on
🌱 DataSprout: IoT sensor monitoring system
[GitHub Repo] [Project Demonstration Video]
I’ve been fortunate to grow up with parents who love to garden, which means I’ve enjoyed for as long as I could remember high quality, hard-to-find fresh fruits and mental boosts that inherently come from being around thriving nature.


Photo of my parent’s thriving garden.
I’ve been unfortunate to find after I moved away that I don’t naturally possess the same affinity for keeping plants alive. To increase my chances of not being labelled as the family’s ‘black thumb’, I’ve come up with an IoT project, which I call DataSprout, to monitor environmental temperature and humidity data, which are vital to a plant’s wellbeing.
To support my plants’ era of thriving, DataSprout uses a Raspberry Pi 5 running the Debian GNU/Linux 12 (bookworm) operating system with connections to a DHT11 sensor and 16x2 I2C LCD panel. The firmware logic to initialize and run the hardware system is written in C. As an extension to the project, a full stack web application has been created using MariaDB as the database, Node.js/Express.js as the backend/API server, and React as the frontend/web client along with the D3.js library to dynamically capture and visualize real-time data. On the technical side, motivation stems from wanting to explore the intersection among electrical engineering, computer engineering, and software engineering in the form of hardware components that include sensors with a full-stack web app built from scratch. Additionally, with a particular interest in data visualization, I wanted to craft the foundation of a monitoring dashboard which would encourage more frequent plant monitoring but also could be expanded on for future technical projects, which I foresee will be useful as data drive decisions across different telemetry applications.
DataSprout Platform Features
- LCD Panel display of the latest temperature and humidity sensor reading with corresponding timestamps using a Raspberry Pi 5 and DHT11 sensor
- Full stack web app data monitoring dashboard
- RESTful API endpoints for querying time-series and aggregated stats data with start and end date filtering
- Date picker calendar dropdown to prompt data filtering
- Line graphs of temperature and humidity data with interactive tooltips that display data values on hover
- Dynamic data display without requiring full page refresh
- Real-time sensor data collection running in the system’s background to ensure continuous data capturing even when the web app is not running
- Automated Bash scripts to start and stop the frontend, backend, and data collection services with a single command execution
- Modular system design allowing for easy integration of additional sensors, features, or services to support future scalability and upgrade efforts
Tech Stack
HARDWARE:
- Raspberry Pi 5
- 16x2 I2C LCD Panel
- DHT11 temperature and humidity sensor
- Dupont jumper wires
- GPIO 40-pin Breakout Extension Board
SOFTWARE:
- MariaDB
- C firmware logic code
- React
- Node.js
- Express.js
- D3.js
- Bash scripting
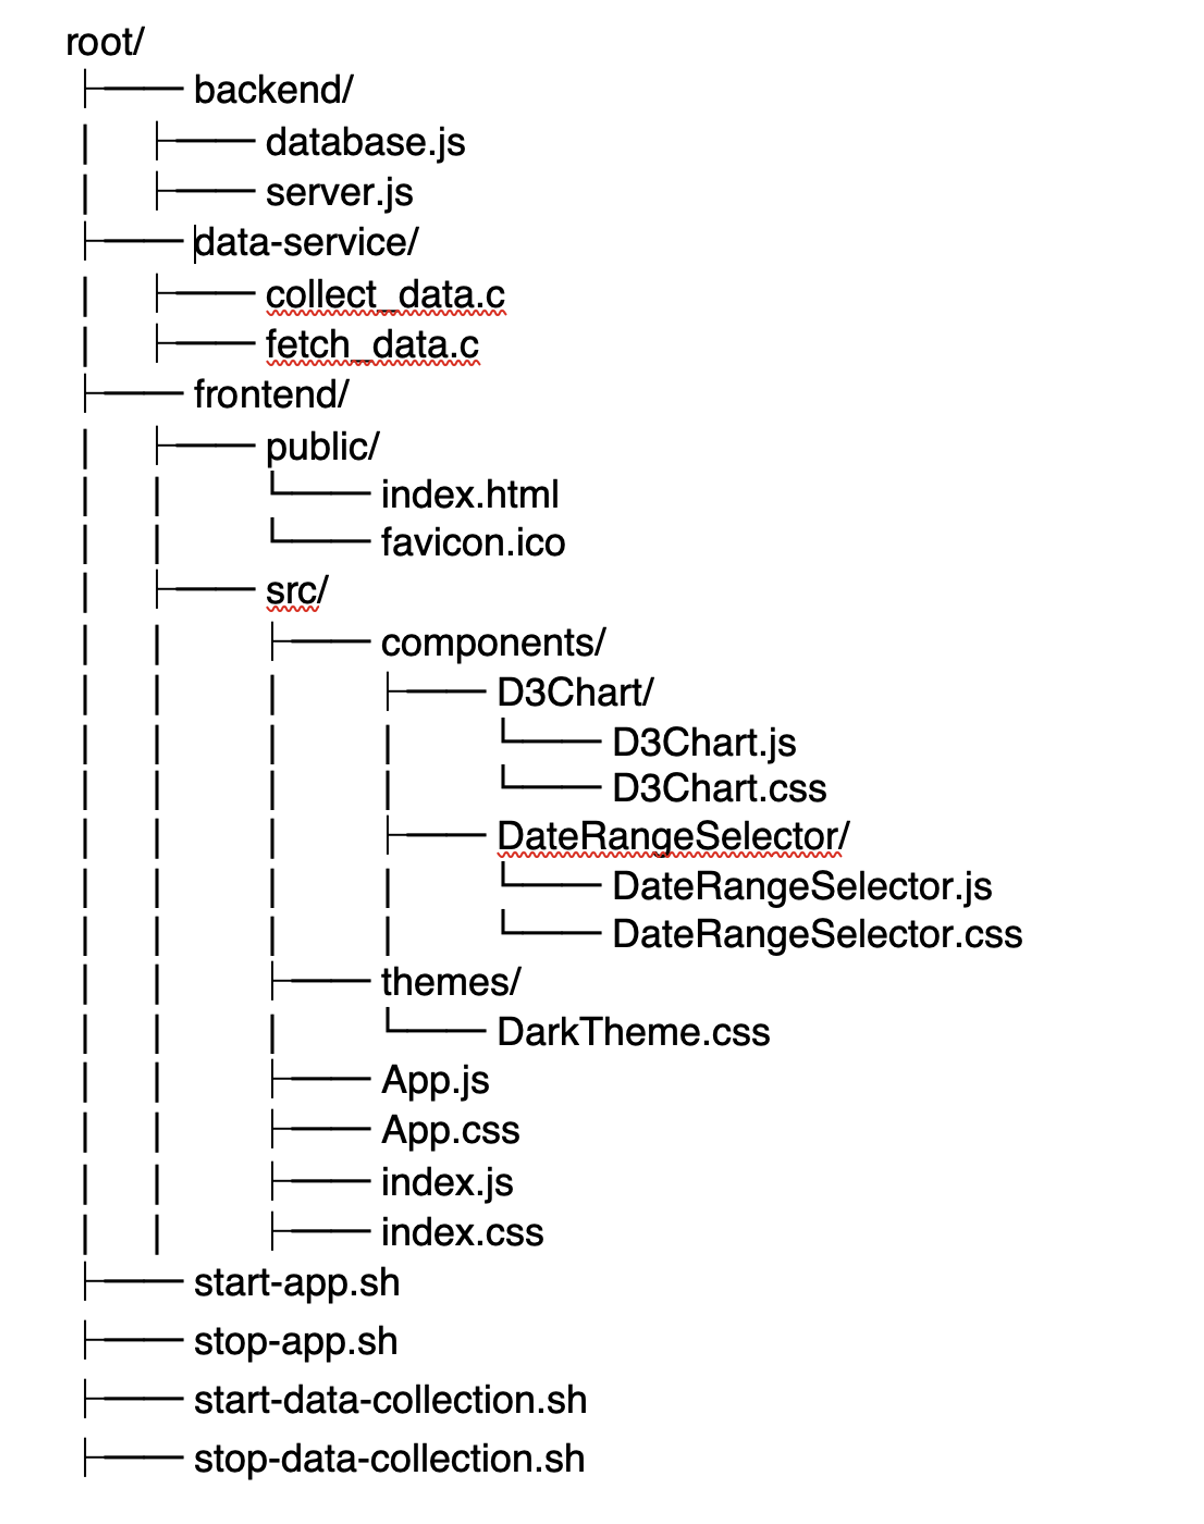
Project Structure
System Design and Setup Overview
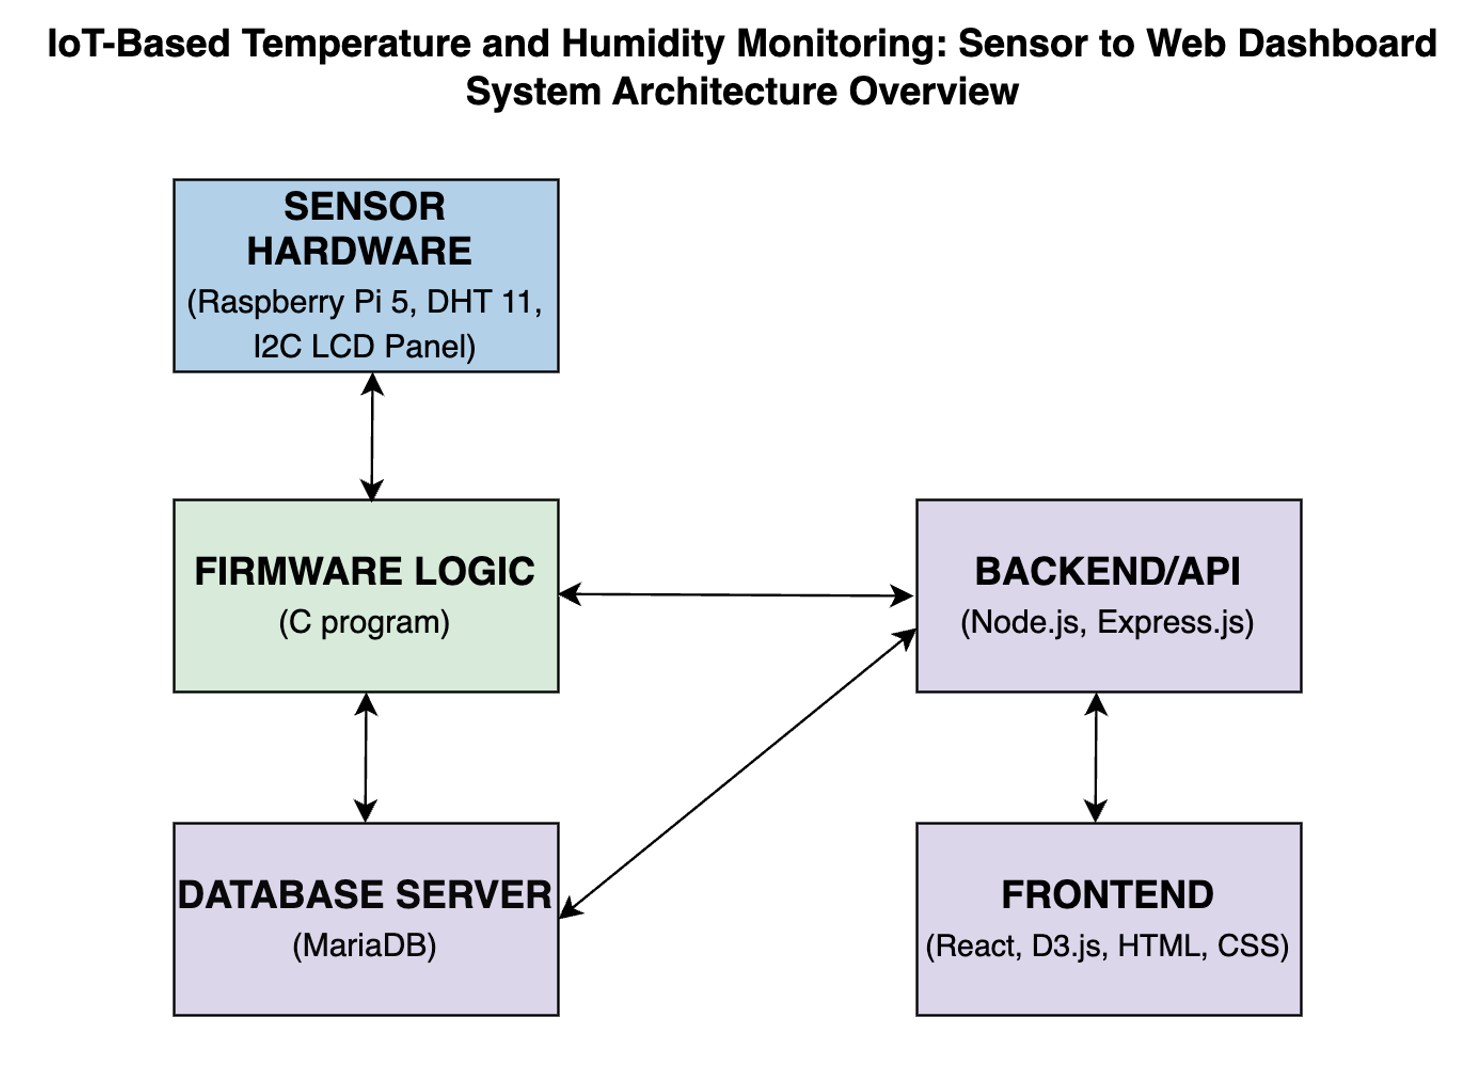
System Architecture Overview diagram. Sensor data flows among the hardware components, database, and web server
HARDWARE
A Raspberry Pi 5, equipped with a GPIO 40-pin Breakout Extension Board, is connected with Dupont jumper wires to a full sized 830-point breadboard, DHT11 temperature and humidity sensor, and a 16x2 I2C LCD panel.
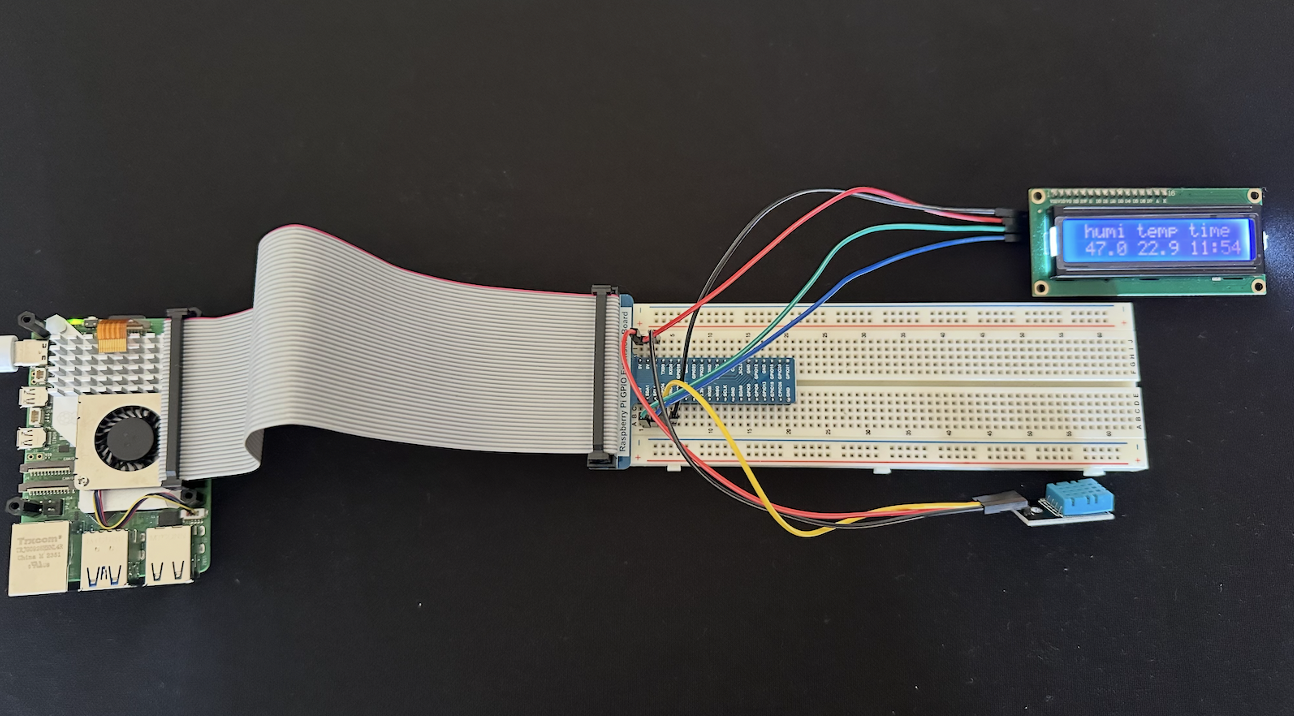
Screenshot of DataSprout Platform hardware setup.
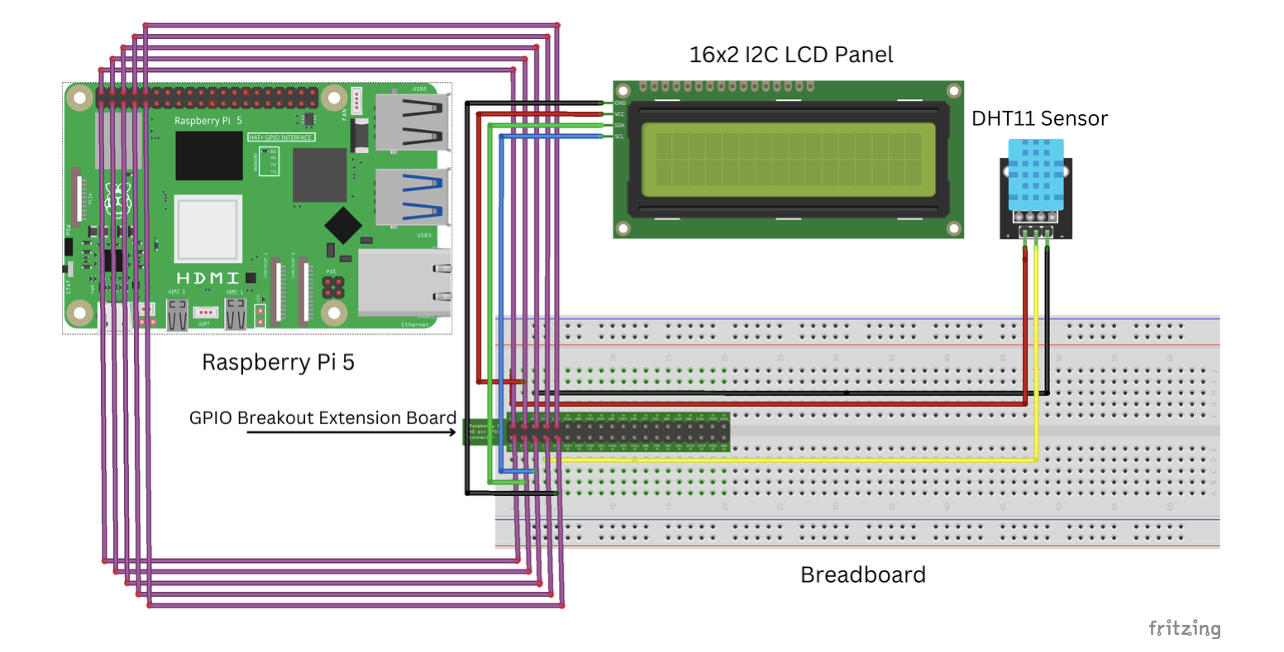
Fritzing circuit wiring diagram showcases the connections needed for the Raspberry Pi 5, breadboard, I2C LCD panel, and DHT11 temperature and humidity sensor.
| Hardware Component | Pin on Component | Connects to Pi Pin # | Function |
|---|---|---|---|
| DHT11 Sensor | VCC | Pin 2 | 3.3V Power |
| GND | Pin 5 | Ground | |
| DATA | Pin 7 | Digital Input (Sensor Data) | |
| I2C LCD Panel | VCC | Pin 4 | 5V Power |
| GND | Pin 9 | Ground | |
| SDA | Pin 3 | I2C Data | |
| SCL | Pin 6 | I2C Clock | |
| GPIO Breakout Extension Board | All 40 Pins | Connected to GPIO Header | Extends access to all GPIOs |
Wiring chart details the wiring connections needed among the hardware components with jumper wires.
HARDWARE/SOFTWARE INTERFACE: FIRMWARE LOGIC
1. DATA COLLECTION
FIRMWARE LOGIC –> SENSOR HARDWARE –> FIRMWARE LOGIC –> DATABASE SERVER
After the Raspberry Pi 5 is powered on, the DHT11 sensor and I2C LCD display panel remain idle until triggered by a signal set off by the firmware logic. This activation is initiated by executing a ‘nohup’ command within the start-data-collection.sh script, which runs the collect_data.c program (refer to Appendix A) to: (1) read data from the sensor, (2) display it on the LCD panel, and (3) insert the data into a MariaDB database. These operations repeat every 30 minutes until either the Raspberry Pi is shut down or the process is explicitly terminated using the stop-data-collection.sh script. The use of the POSIX nohup command (short for ‘no hang up’) ensures the data collection process continues running in the system’s background even if the user logs out or the session ends.
2. DATA FETCH
In a fully modular and independent process, the frontend and backend of the full stack web application are launched through a Bash script (start-app.sh) using ‘pm2’, which retrieves data from the database and serves it to users through the web interface.
1. FRONTEND –> BACKEND
The user interacts with the React frontend by specifying the start and end dates of the data window they want to view. These dates are selected using a calendar date picker dropdown menu. Upon selection, the setStartDate() and setEndDate() functions are invoked to update the component state in App.js.
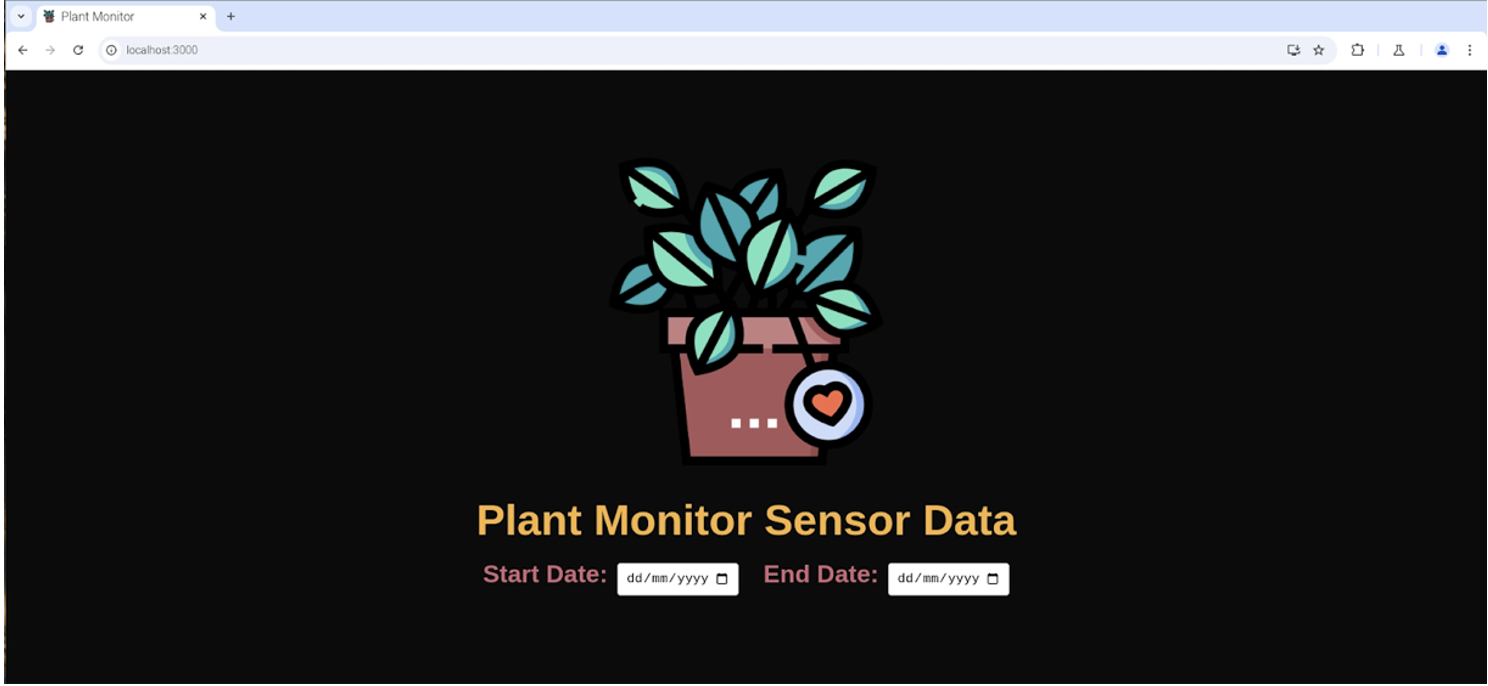
DataSprout Platform app landing page.
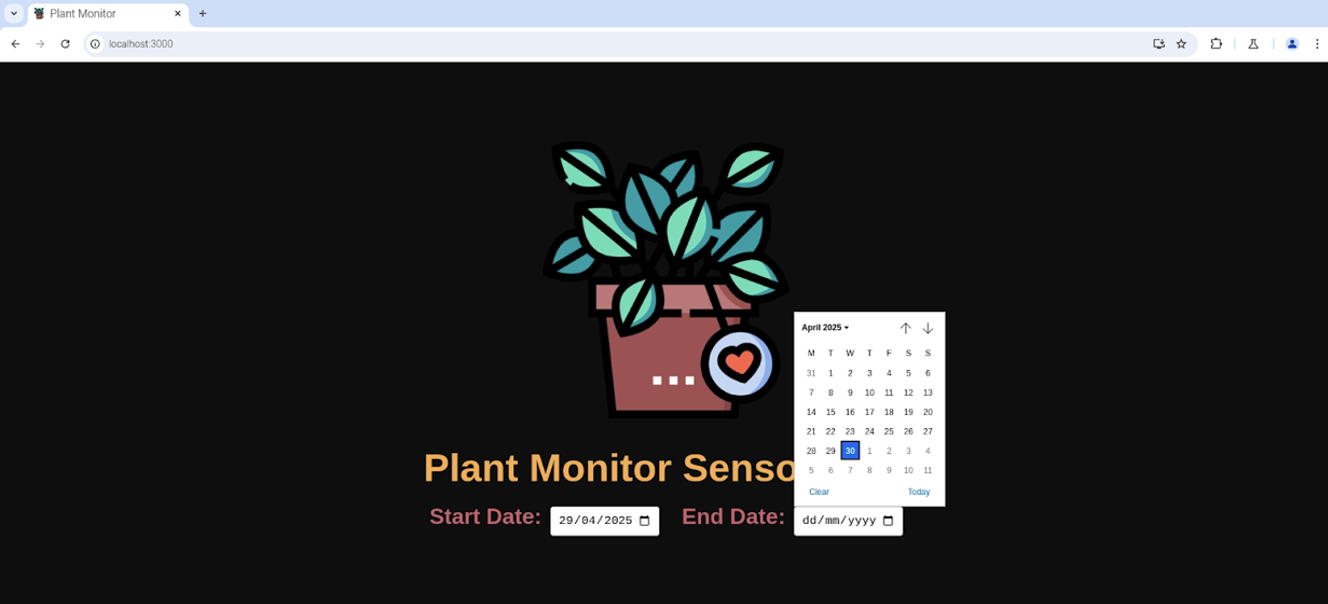
Date picker UI showcase of the DataSprout Platform app.
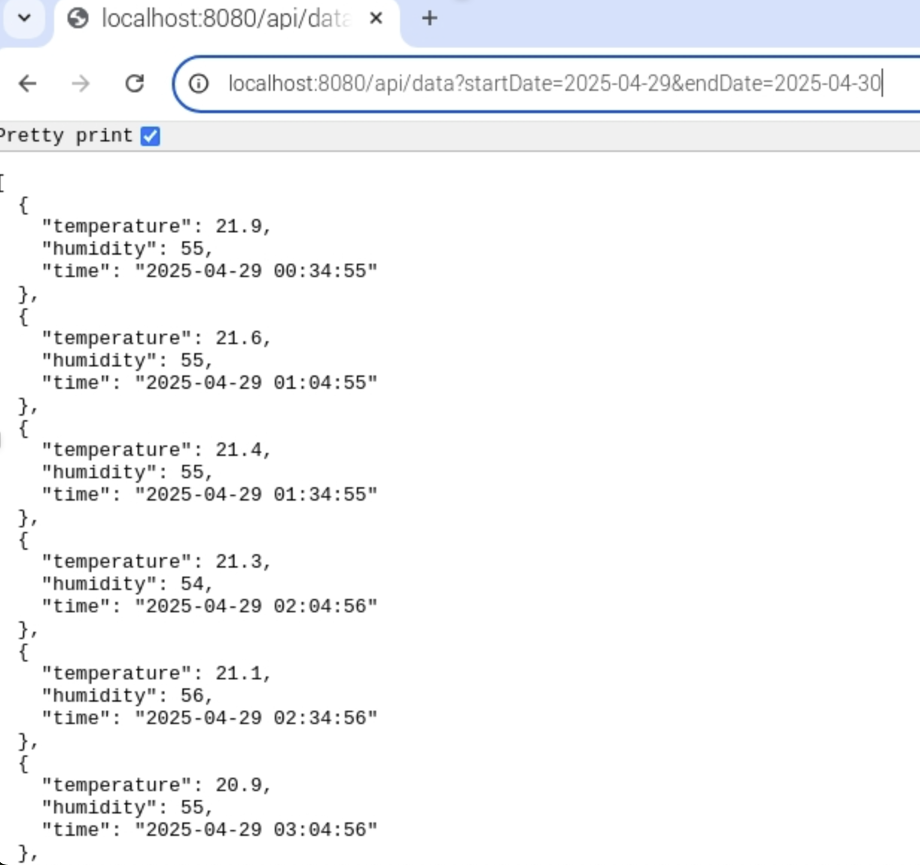
After React re-renders App.js with the new state, a useEfect hook that watches [startDate, endDate] is triggered. This hook initiates data fetching from the following two RESTful API endpoints:
- http://localhost:8080/api/data?startDate=${startDate}&endDate=${endDate}
- Returns raw sensor data with associated timestamps.
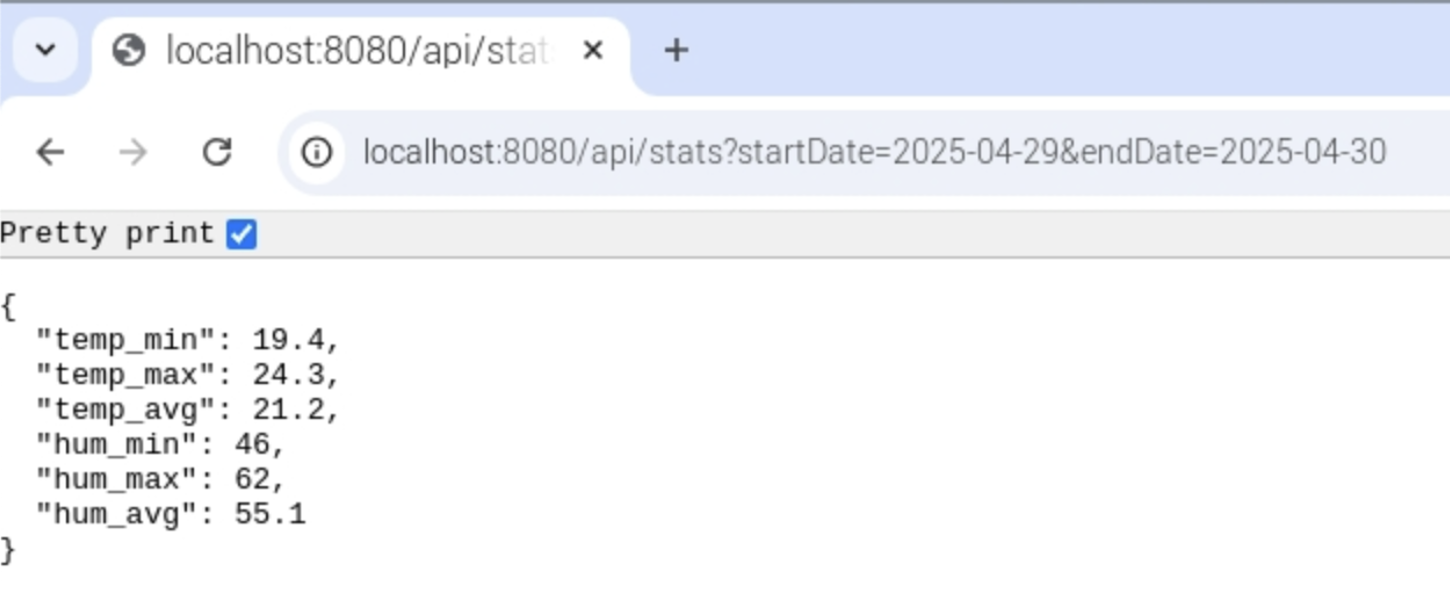
- http://localhost:8080/api/stats?startDate=${startDate}&endDate=${endDate}
- Returns aggregated data statistics including minimum, maximum, and average values.
2. BACKEND –> FIRMWARE LOGIC –> DATABASE SERVER
A Node.js server (Server.js) built with the Express framework exposes two API endpoints: /api/data and /api/stats.
The /api/data endpoint handles requests for raw sensor data. It extracts startDate and endDate from the query string (req.query) and uses them to construct a shell command that executes a compiled C binary:
../data-service/fetch_data ${startDate} ${endDate}
This binary is responsible for interfacing with the database to retrieve raw sensor readings for the specified date range. The Node.js ‘exec’ function from the child_process module is used to execute the command. The server captures the binary’s output through stdout and stderr. The stdout data is split by line breaks and parsed into an array of objects, each containing the following properties: temperature, humidity, time. This array, ‘data’, is then returned to the client as a JSON response.
BACKEND –> DATABASE SERVER
The /api/stats endpoint connects directly to the database to compute and retrieve summary statistics. It extracts the startDate and endDate from the query parameters and performs an SQL query to calculate the minimum, maximum, and average values for temperature. After the query is executed, the results are formatted into a JSON object and sent back to the client in the response.
SOFTWARE
DATABASE SERVER –> BACKEND –> FRONTEND
The frontend communicates with the backend API endpoints to retrieve both raw sensor data and aggregated statistics. This data is then used to render a responsive, animated line chart using React and the D3.js library.
Each chart includes a number of aesthetic and interactive enhancements for improved user experience: tooltips for closer data inspection, smooth animations for transitions and updates, formatted axes for readability, grid lines for visual guidance, and gradient fills to enhance visual appeal. This integration of backend data with dynamic frontend visualization enables real-time, intuitive monitoring of sensor metrics.
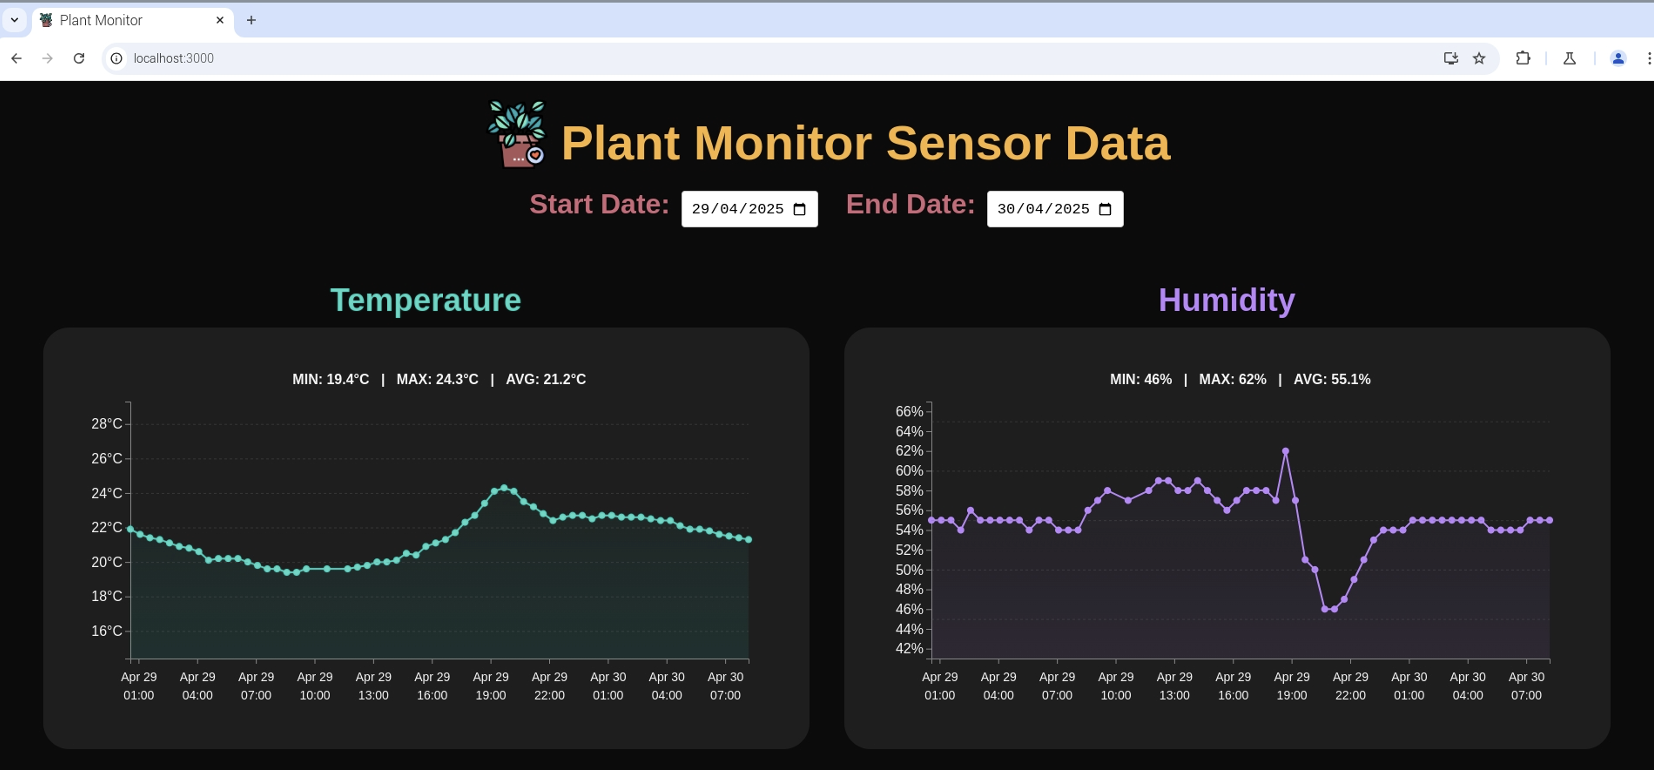
Temperature and humidity line graphs are displayed as soon as dates to filter on are chosen. Statistics such as the minimum, maximum, and average corresponding to the selected data are also calculated and displayed.
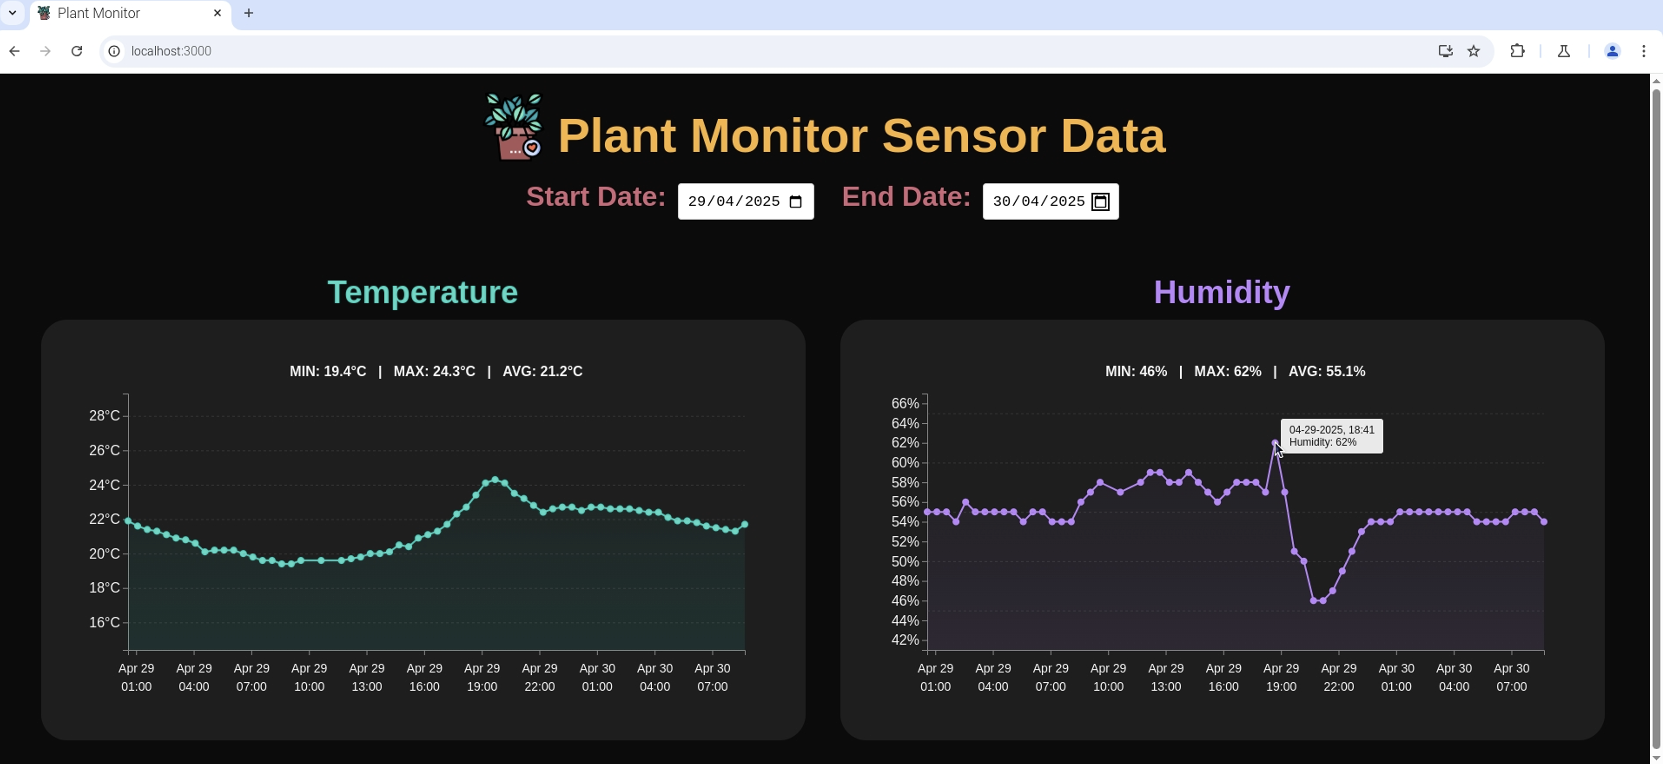
An interactive tooltips feature has been added for precise data inspection.
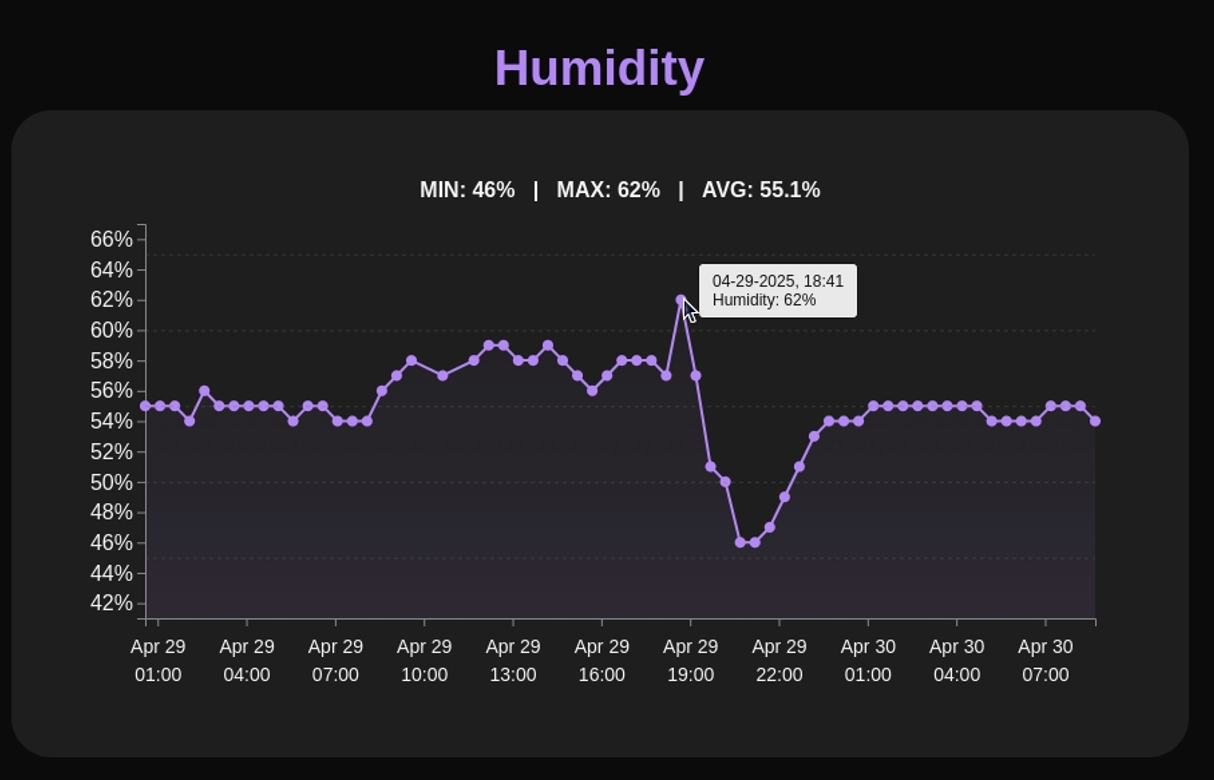
A close up of the tooltip feature of the app. The measure of every data point of both graphs can be displayed with the simple hovering of the mouse over the data point.
An important architectural detail is that the data collection logic operates independently from the web server. This separation ensures that the web server can access and display newly collected data in real time without needing to control or wait on the data acquisition process. With the app’s modular and dynamic design, users can adjust the date range as often as they would like. When the date range is changed, the frontend fetches and displays updated data without requiring a full page reload, resulting in a smooth and responsive user experience.
Design Decisions, Additional Considerations, and Concluding Thoughts
Crafting my own open-ended project and having the grit to finish it in its entirety within a narrowed scope that I define myself was not trivial. I wrestled with countless internal debates: Should I add a carbon dioxide sensor to the DataSprout Platform? Should I use Plotly.js instead of D3.js for data visualization? Should I use React or Angular, MariaDB or MySQL, Python or C for the tech stack? Some decisions were made for me such as when I realized after implementation that Plotly.js was just too heavy for the Raspberry Pi OS. Others came from trial and error and testing different paths until a decision felt right. For example, I used a C binary to fetch and expose data from the database server for the /api/data endpoint, whereas I queried the database directly using SQL for the /api/stats endpoint. While I could have used either approach for both endpoints, I intentionally chose different methods to better understand the various data flow options. Through that process, I found that using the C binary for the /api/data endpoint aligned more naturally with the firmware’s architecture, whereas going through C for /api/stats, which only returns a summary of the data, would have added unnecessary complexity.
I’m truly chuffed with the outcome of this project. While building, I gained a deep understanding of just how crucial system design and computer architecture are and how challenging it can be to pass data between hardware and software layers. Bridging that gap was one of the most rewarding (and frustrating!) parts of the crafting experience. Another big takeaway was realizing how long the final polishing stages take. The finishing touches which include the UI tweaks, bug fixes, and documentation ended up consuming just as much time as building the core functionality but it’s those final details that make me giddy with satisfaction when I see the project in its completed form.
Discussion and feedback