on
Chemical Electronic Nose
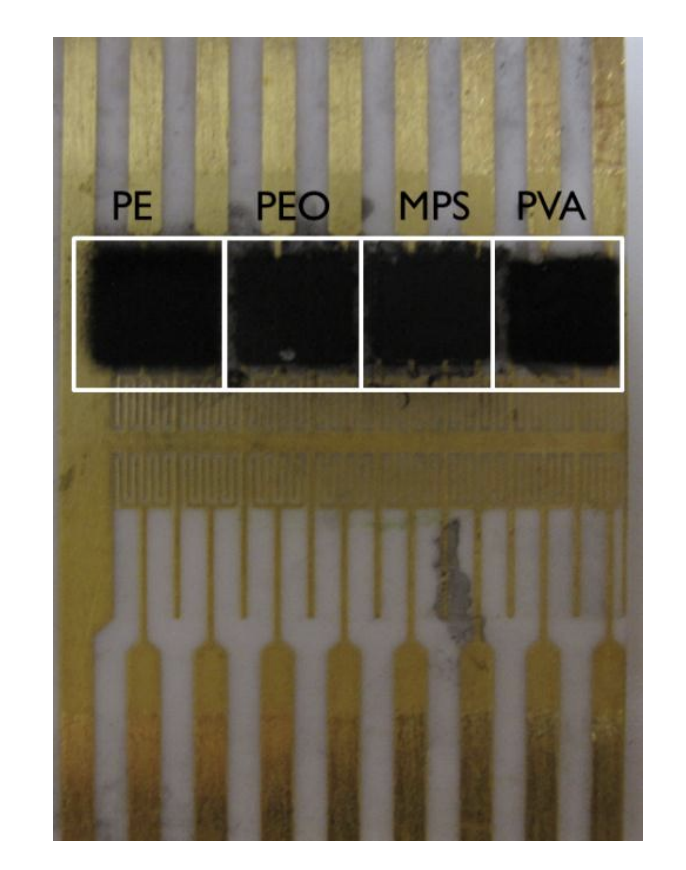
Figure 1. Picture of the four sensors of the CSA. The four polymers used for each chemiresistor are: polyethyelene (PE), poly(ethyelne) oxide (PEO), modified polystyrene (MPS), and polvinyl alchol (PVA)
Abstract
We have designed and manufactured a Chemical Sensor Array (CSA) that can identify the vapors of three different chemicals: acetone, dichloromethane, and n-hexane. Our CSA is composed of a substrate with electrodes for four different chemiresistors. Each chemiresistor is a chemical sensor composed of various polymers and carbon black. The polymers used for the fabrication of the chemiresistors are: polyethylene, poly(ethylene) oxide, modified polystyrene, and polyvinyl alcohol. The interaction between the polymer and the chemical vapor of interest results in various sensor signals that can be analyzed for pattern recognition. Two methods, known nearest neighbors (KNN) and k-Means, are used on the data to identify and differentiate among the various chemical vapors. During external testing, it was determined that k-Means was able to correctly identify the chemicals 20% more often than KNN was capable of accomplishing.
Introduction
The motivation of the project stems from the possibility of applying the chemical sensor array technology to the paint industry. Paint companies, such as ICI Dulux Trade® and Benjamin Moore®, manufacture both paints and paint removers at the same facility[1, 2]. This practice becomes problematic when chemicals that enhance properties desired in paint removers are accidentally mixed in with paints and vice versa. Chemicals such as dichloromethane and acetone facilitate the removal of paints from a surface by causing the original paint to swell,resulting with weakened adhesion between the paint and the surface underneath it. On the other hand, volatile organic chemicals such as n-hexane are crucial in paints to promote even applications and quick drying. Mixing the two types of chemicals has the potential to result with the paint being unable to adhere to a surface or the paint remover drying too quickly. This project focuses and studies the ability to distinguish among the chemicals: acetone, dichloromethane (DCM), and n-hexane.
To avoid any such accidents, there is a dire need to find a method to identify these chemicals readily with the mindset of maintaining production efficiency. Current procedures that are being used include infrared spectroscopy, gas chromatography, and mass spectroscopy. Although these techniques are able to precisely identify unknown chemicals, the instruments used are not portable and require a minimum processing delay of approximately 20 minutes. Visual differentiation among these chemicals is not a reliable method because chemicals such as the ones being studied in this paper are transparent, colorless liquids. Olfactory sensory means are also not an ideal method due to the possible adaptation and loss of sensitivity of the workers after a given amount of time[3]. These issues have led to various attempts at fabricating a sensor array. Prior attempts of a sensor array include heated metal oxide thin film resistors, polymer sorption layers on the surfaces of acoustic wave resonators, or arrays of electrochemical detectors[4]. Metal oxide thin film resistors do not allow control of the chemical response or reproducibility among various arrays[4]. Surface acoustic wave resonators are also not ideal because they involve the use of complicated electronics[4].
In an attempt to resolve all of these issues, we have designed and studied a chemical sensor array that is able to quickly differentiate among model chemicals used in the industry: acetone, dichloromethane, and hexane. Our approach includes a combination of conductive carbon black and nonconductive polymers with the mindset that polymer elements swell upon exposure to a chemical vapor. This phenomenon allows different direct low-power electrical signal readouts for each polymer, which can be used as sensor response signals. The patterns created by the sensor signals when the CSA is exposed to a certain chemical can be analyzed and used to identify the specific chemical. By using this technology, we have prepared a polymerbased sensor array that uses distinct electrical resistance responses to various vapors to distinguish unidentified chemicals.
Apparatus and Methods
Preparation of the polymer solution In a 20 mL scintillation vial, a solution was prepared by mixing 80 mg of a polymer, 20mg of carbon black, and 10 mL of tetrahydrofuran (THF, VWR/EMD, TX 0280-7). Four different solutions were prepared with the following polymers: polyethylene (PE, Aldrich, 427799), polyethylene(oxide) (PEO, Aldrich, 181986), modified polystyrene (MPS, Local Startup), and polyvinyl alchohol (PVA, Aldrich, P8136). The solutions were then sonicated for approximately eight minutes to ensure complete mixing. The prepared solutions were used for CSA fabrication within an hour of mixing.
Chemical sensor array fabrication Using an airbrush (Badger, Model 150), the prepared solutions were deposited onto four distinct positions on the substrate, as shown in Figure 1. In order to spray the solutions in specific areas of the sensor, a substrate holder was used to keep the chip into place while a metal mask covered the areas of the substrate that were not desired for polymer deposition . Multiple coats of each solution were airbrushed onto the substrate until it was visually obvious that the electrodes were completely covered with the solution. The sprayed area was allowed to dry for approximately five minutes before applying the next prepared solution onto another position on the substrate. After preparing four different chemiresistors onto a substrate, the substrate was left to dry for at least a day before use.
*Data collection * After the CSA was fabricated, the chemical sensor was connected to a 10-channel Multiplexer (Keithley) attached to a multimeter (Keithley, Model 2000), which monitored the resistance of the various chemiresistor elements. Three different chemicals (acetone, n-hexane, and dichloromethane) were tested by exposing the substrate to their vapor. To acquire one data sample, the baseline, which was air, was tested and recorded for one minute. The substrate was then exposed to the chemical vapor of interest until a steady resistance measurement was achieved, usually taking approximately six minutes. Finally, the substrate was exposed to air once again for about one minute until the original resistance measurement was achieved and recorded. Before the next run, the sensor was exposed to air for another five minutes to ensure that the CSA is completely flushed of the last chemical vapor exposure.
Data filtration Data filtration was needed because each data point collection included the resistance measurements of the initial and recovery baseline to air when only the steady-state measurements of the chemical vapor of interest were desired. Two different methods were used to prepare the raw data for pattern recognition analysis. One method was manually picking out the data points thought to give the most representative of the steady-state resistance measurements data. The other method attempted was automating the choices of data points by taking the maximum of the resistance measurements after removing the spikes in resistance measurements. The spikes in resistance measurements occur when the sensor is exposed from the baseline vapor to the vapor of interest and back to the baseline. Because each chemiresistor resulted with two channels of resistance measurement readings, the reading that had the lower standard deviation was chosen for the training data set and chemical identification.
*Identification of chemicals *
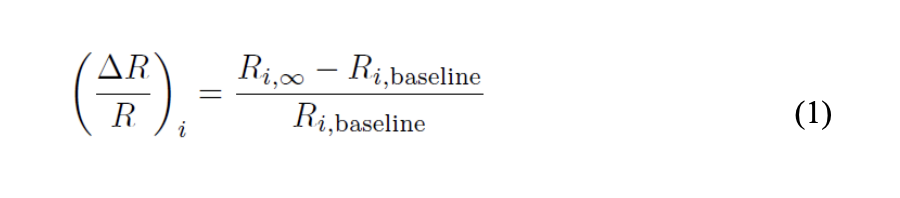
After acquiring the filtered data, we used the chemical sensor responses to the various chemical vapors for pattern recognition analysis. The average of the resistance measurements was taken in order to acquire R∞. We would then use equation (1) to achieve our chemical sensor response to the vapor of interest.
A training data set of 33 data samples with 11 data samples for each chemical vapor exposure was acquired. A program was then designed to recognize the patterns of the sensor responses to the various chemical vapors in the training data set and to use that information to identify or reject unidentified chemicals not in the training set. Known Nearest Neighbors (KNN) and k-Means methods were both used to analyze the chemical vapors of interest. KNN identifies a chemical based on a given number of neighboring data points and always identifies a test sample as one of the chemicals. In our case, however, we would reject the chemical if all of the chosen neighboring data points did not belong to the same chemical in the training set. On the other hand, k-Means identifies a chemical based on a set number of standard deviation and identifies a test sample as one of the chemicals unless a cut-off value is specified. Specific to this project, three nearest neighbor data points were used for KNN and a standard deviation of two was used as a cut-off value for k-Means.
Results/Discussions
A CSA was designed and fabricated to differentiate among the three chemicals of interest: n-hexane, acetone, and dichloromethane. The polymers chosen played a vital role in acquiring sensor signals that were unique for each specific chemical, allowing the possibility of identifying the desired chemicals. The analysis of two methods used to filter the raw data also heightened the ability to differentiate among the various chemical vapors correctly. Despite the fact that it took more time, we found that manually filtering the data had a 4% greater chance of identifying the given chemicals correctly than the automated method described in the experimental section. During external testing, we found that k-Means, compared to KNN, was able to correctly identify the chemicals 20% more often. Although KNN was able to correctly identify pure chemicals 17% more often than k-Means was able to, KNN was not able to reject the identification of a chemical mixture or a completely unknown chemical, which is alarming for industry process applications. Based on our application of applying this technology to the paint industry, it is preferred to reject a chemical sample than to continue using the chemical in the production of paint or paint remover. With the chosen polymers and the methods of preparing the data, we have manufactured a chemical sensor array that is able to distinguish among the three different chemicals.
Based on the findings of the Lewis lab at Caltech, we chose polymers that were thought to acquire distinct sensor signal patterns[4]. PEO and PVA were chosen because they are polar and thought to interact with the polar chemicals, acetone and DCM, in a different manner than with the nonpolar chemical, n-hexane. For the completely opposite reason, MPS and PE were chosen with the intention that n-hexane would interact uniquely with the nonpolar polymers, resulting in a broad range of unique sensor signals. While DCM and acetone can be categorized as polar compounds with polarity indexes of 3.1 and 5.1 respectively, n-hexane can be categorized as a nonpolar compound with a polarity index of 0.0.
Although this theory may seem plausible, the data results do not directly support the idea of polarity playing a large role in determining the chemical responses to the vapors. This is mostly due to the fact that certain polymers such as PE and PEO do not have significant changes from the baseline resistance measurements to the vapor of interest resistance measurements. In the representative graphs of the raw data of each of the chemical exposures as shown in Figure 2, it is roughly approximated that PE has a 22.2% increase in resistance measurement and PEO has an increase in resistance measurements of 40.5%. Although this may seem to be significant, this is prevalent throughout the data of all three chemical vapors, which proves that the sensor signals for these polymers are not unique for each of the three chemical vapors of interest. On the other hand, MPS does correlate to the theory by having a noticeable difference in resistance change between the nonpolar and polar chemical vapors. In DCM and acetone, the vapor of interest resistance measurements is approximately 3.25 times larger than the baseline resistance measurements. While for n-hexane, there is only a 50% increase in measurements. The resistance measurements collected by PVA do not support this theory at all because the only noticeable resistance measurement changes are in DCM, but not in the other chemicals. Therefore, it is somewhat unlikely that the polarities of the polymers are the main cause of the electrical responses of the chemicals based on exposures to the chemical vapors.
Despite the lack of correlation among the interactions among similar polar chemical vapors to polymers, there does exist unique sensor signal patterns for each of the chemicals. As shown in Figure 3, two three-dimensional graphs demonstrate that each chemical does have a unique clustering of data points in response to the given polymers. It is with these distinct patterns that we can use two methods, KNN and k-means, to analyze the patterns formed with the sensor signals in order to identify the desired chemicals. KNN uses the given number of nearest neighbors to identify the chemical sample, whereas k-Means uses a given number of standard deviations. We were not able to tell by initial theoretical analysis which method was better, so both methods were designed and tested in order to determine which one was better. With a training data set of 11 data points for each chemical vapor, nine chemical vapor exposures were used to fine-tune the program to correctly identify as many unknown chemicals as possible while analyzing the capabilities of the methods, KNN and k-Means. Six of the nine chemical vapor data tested were two samples of each of the three chemicals used for the training data set. The remaining three samples were 50/50 mixtures of acetone and dichloromethane, dichloromethane and n-hexane, and n-hexane and acetone. There were three methods of testing that were used: internal testing, cross validation testing, and external testing. Internal testing is taking a data sample from the training data set and attempting to identify that sample. Cross validation testing is when a data sample from the training data set is also taken and tested.
However, the sample is removed from the training data set. The ultimate test is external testing where samples that are completely not related to the training data set is tested and verified. As shown in Figure 4, both k-Means and KNN were capable of identifying the chemical samples relatively accurately using internal, cross validation, and external testing. This is expected since the training data set is specifically tailored to these chemicals. However, when the system was exposed to mixtures of the chemicals, k-Means was able to identify all of the mixtures as “not classified,” while KNN had a 100% rate of identifying the unknown chemicals incorrectly by identifying them as one of the chemicals of interest. Taking the results of the pure chemical tests into account, we were able to determine that three nearest neighbors were optimal in identifying chemicals with KNN and two standard deviations were optimal with k-Means.
With these parameters, we wanted to evaluate our overall chemical sensor array and data analysis technique by testing five completely unknown chemicals. Both KNN and k-Means were able to correctly identify the three pure chemicals that are prevalent throughout the training data set. The remaining two samples were a 50/50 mixture of DCM and acetone as well as a chemical that the training data set was not familiar with, butanol. KNN and k-Means were both able to reject the identification of the mixture as a known chemical. However, this result is still alarming because KNN was unable to do so while tests were performed when tuning the program, which is essentially the same test except with a period of three days in between. This simply proves that the system is not reproducible yet. Despite the many successes that the two programs were able to achieve, k-Means was able to reject the identification of butanol, while KNN was unable to and identified it as hexane, proving the need for more improvements and studies.
Conclusions A polymer-based chemical sensor array has been designed and fabricated to yield distinctive signal patterns in response to various chemical vapors. The chemical sensor has been able to distinguish among three different chemical vapors (n-hexane, acetone, and dichloromethane), which have been chosen due to their use in paints and paint removers. The results presented in this paper provide a basis for advances in identifying various chemicals using the designed CSA. Recommendations for future work include acquiring a more robust training data set that includes more data collections from the pure chemicals of interest, mixtures of the chemicals of interest, and chemicals that are not in the training data set at all but is likely to exist in the paint companies. Such chemicals can include sodium hydroxide, toluene, methyl ethyl ketone, and xylene. Future work also includes tailoring the sensor to specific places by temperature and humidity
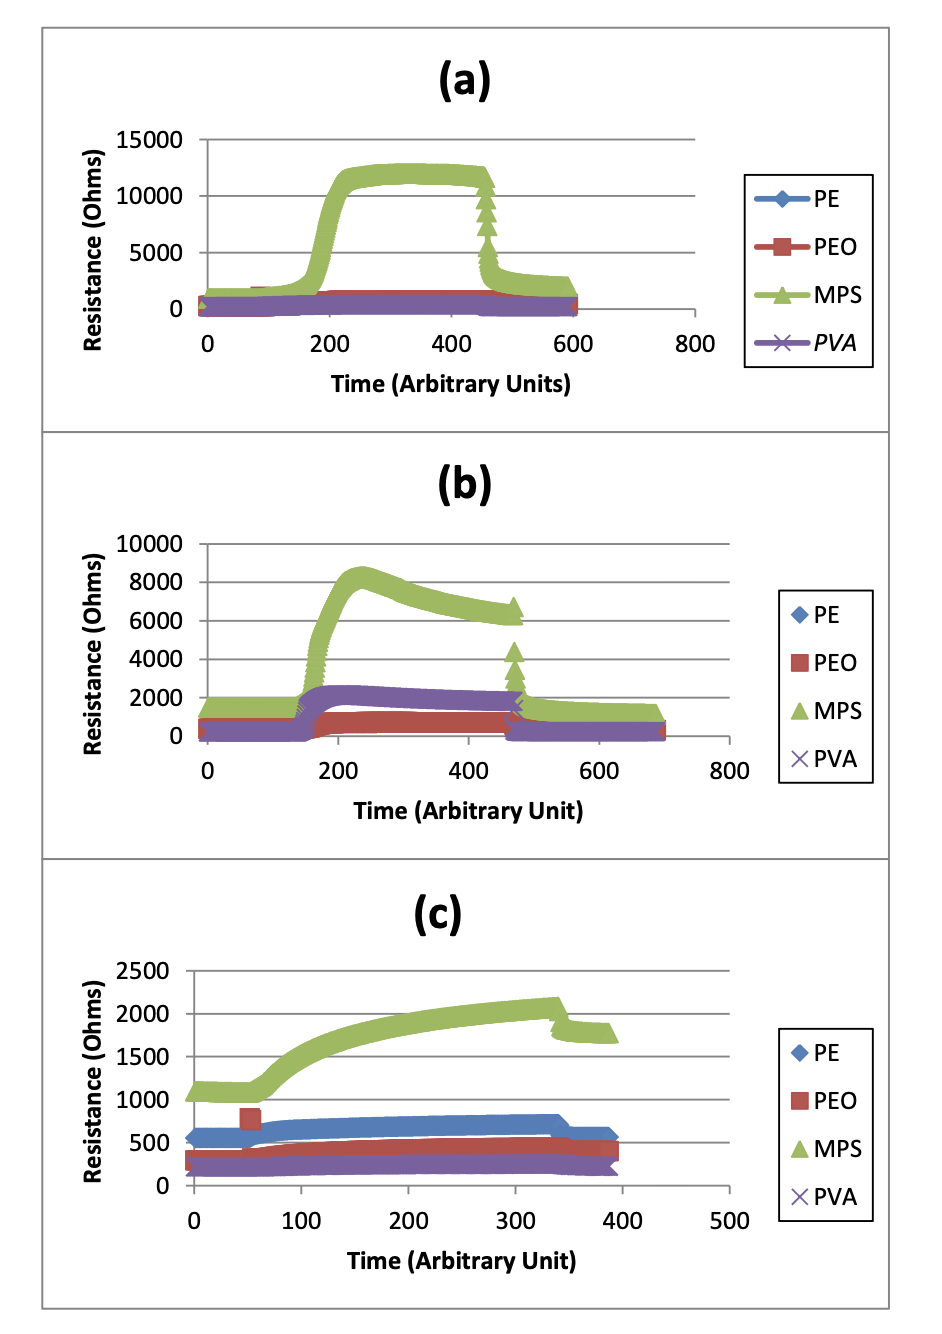
Figure 2. Resistance measurements vs. Time of each of the three chemical vapors of interest: a) Acetone, b) DCM, and c) n-Hexane
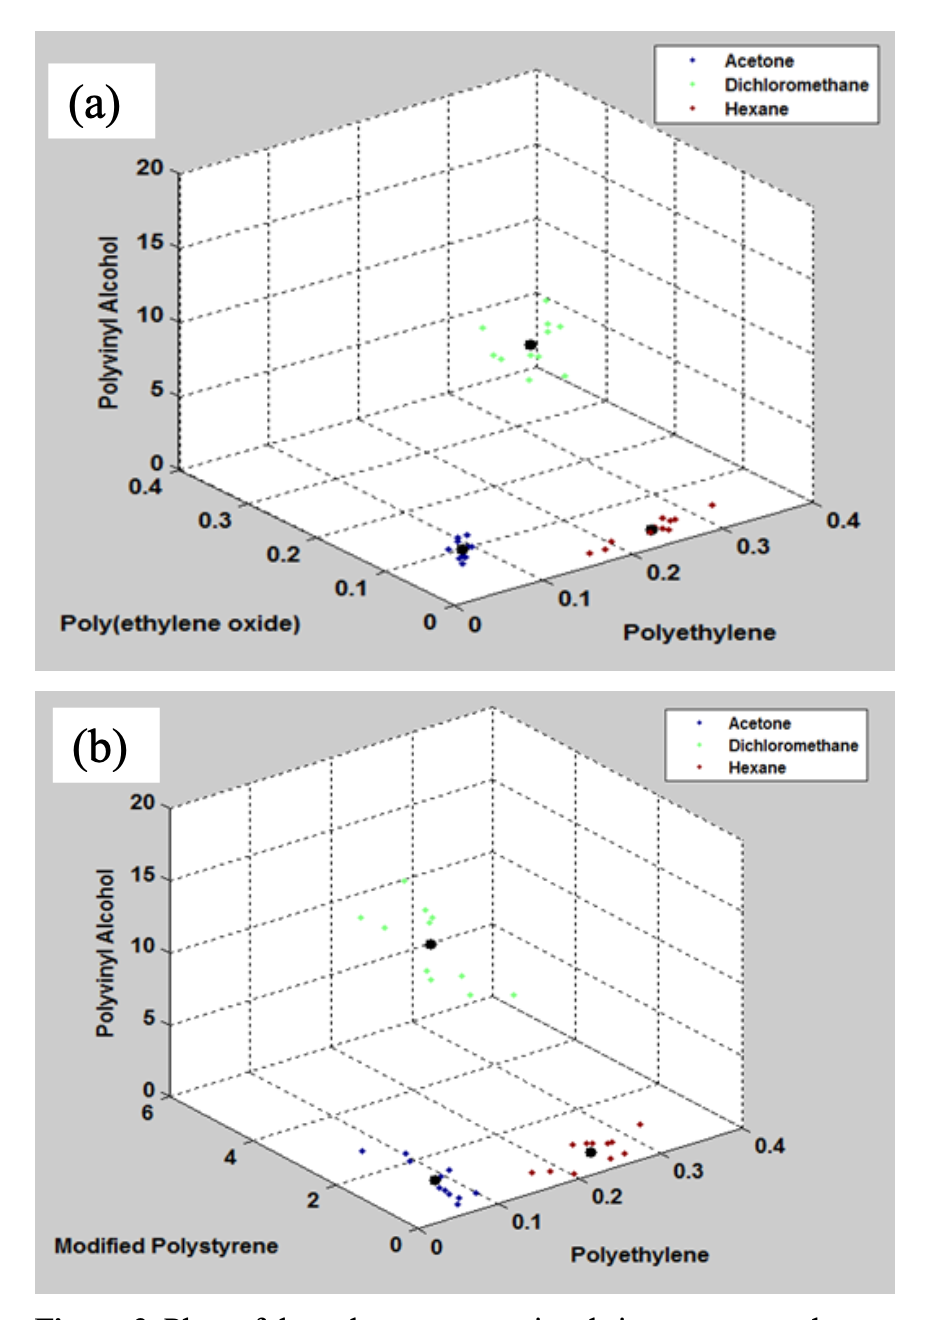
Figure 3. Plots of the polymer sensor signals in response to thethree chemical vapors of interest with a comparison among: a) PVA, PEO, and PE and b) PVA, MPS, and PE </
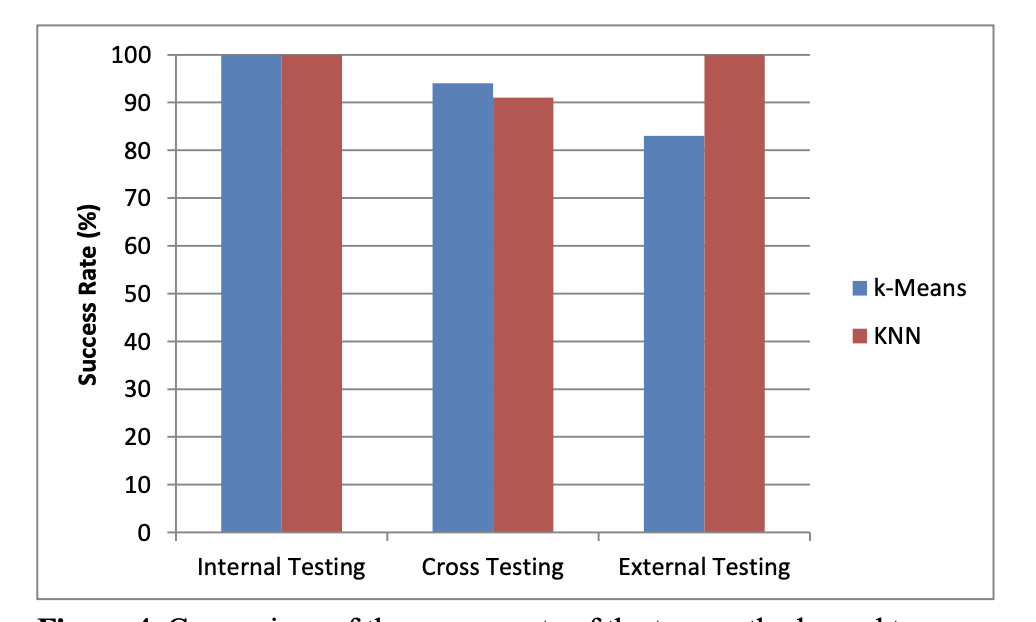
Figure 4. Comparison of the success rate of the two methods used to analyze the data, k-Means and KNN, during internal, cross validation, and external testing.